← Calgary communitiesFind your Calgary

Highland Park Realtor. Full service. Lower fees.

Compare established homes and newer infills in this north inner-city community. Lot dimensions, renovation quality and the layout of each home can make a big difference.

See 25 active listings ↗
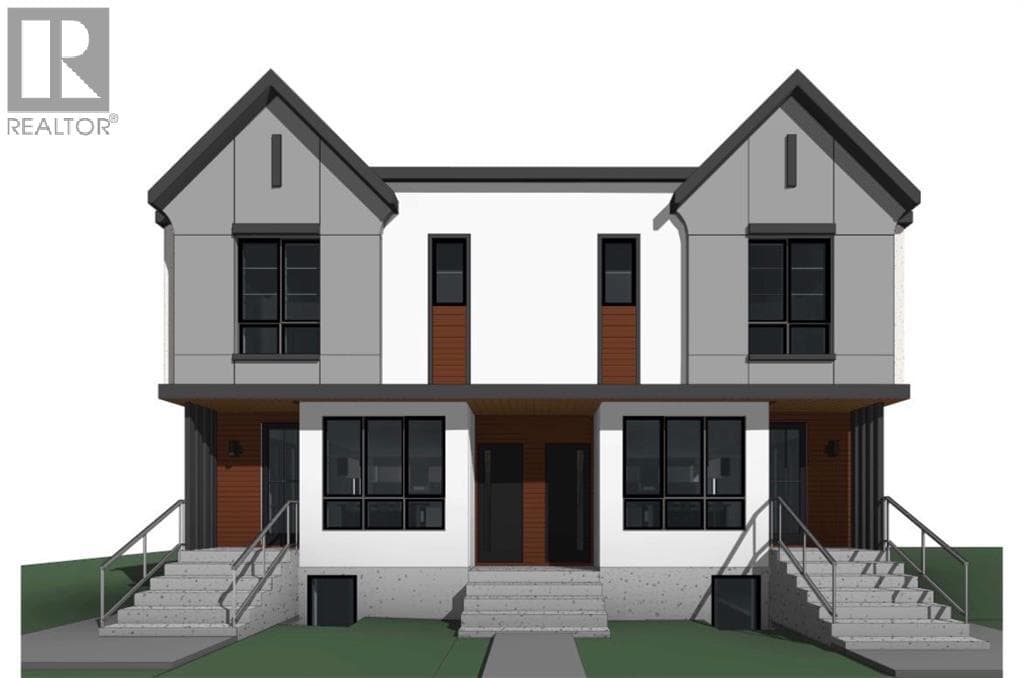
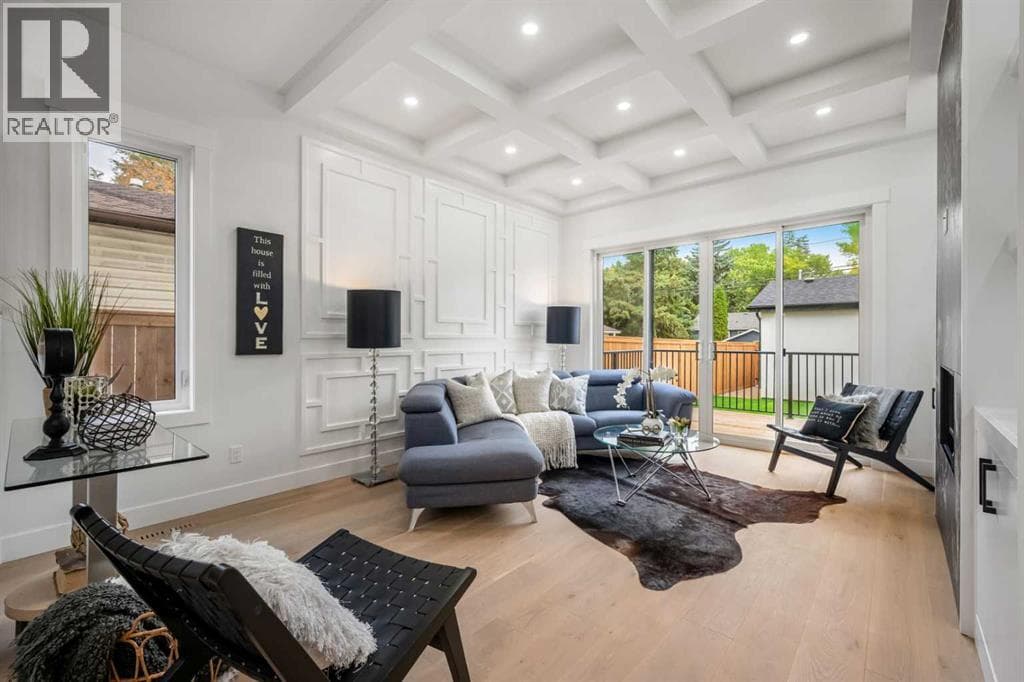
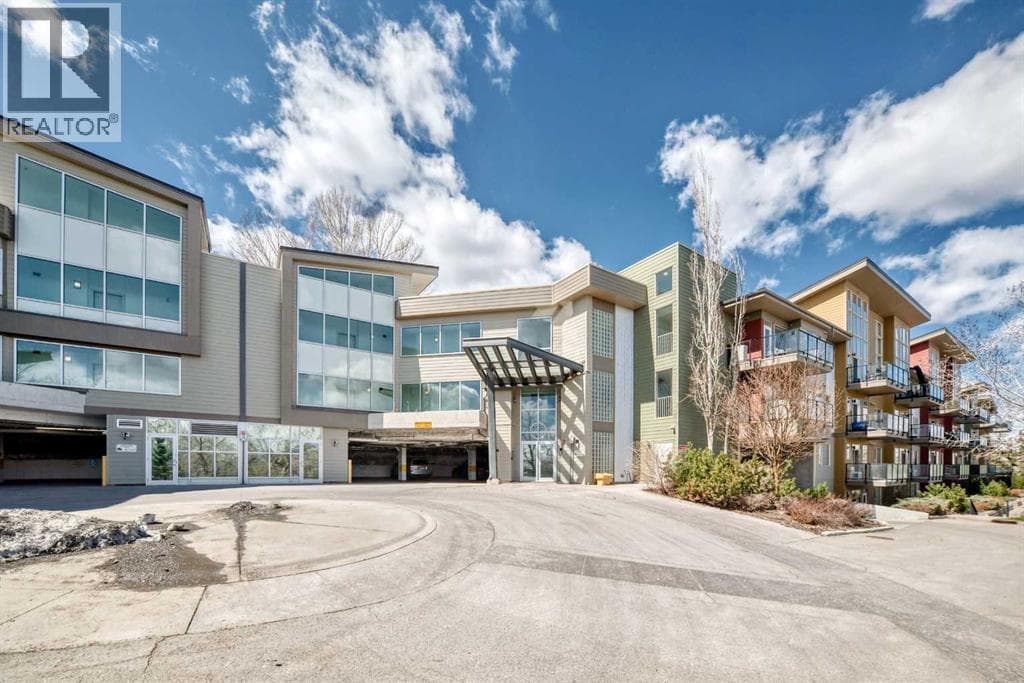
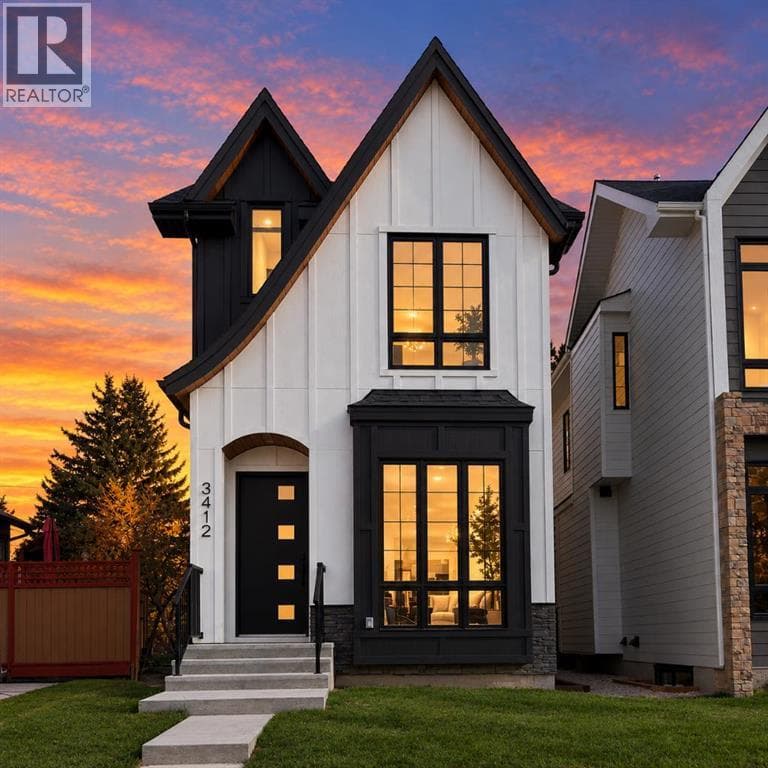
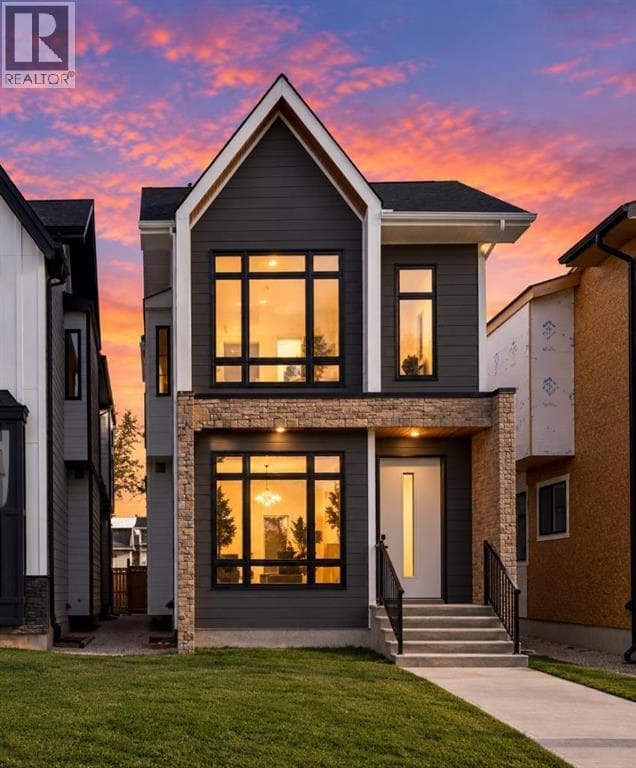
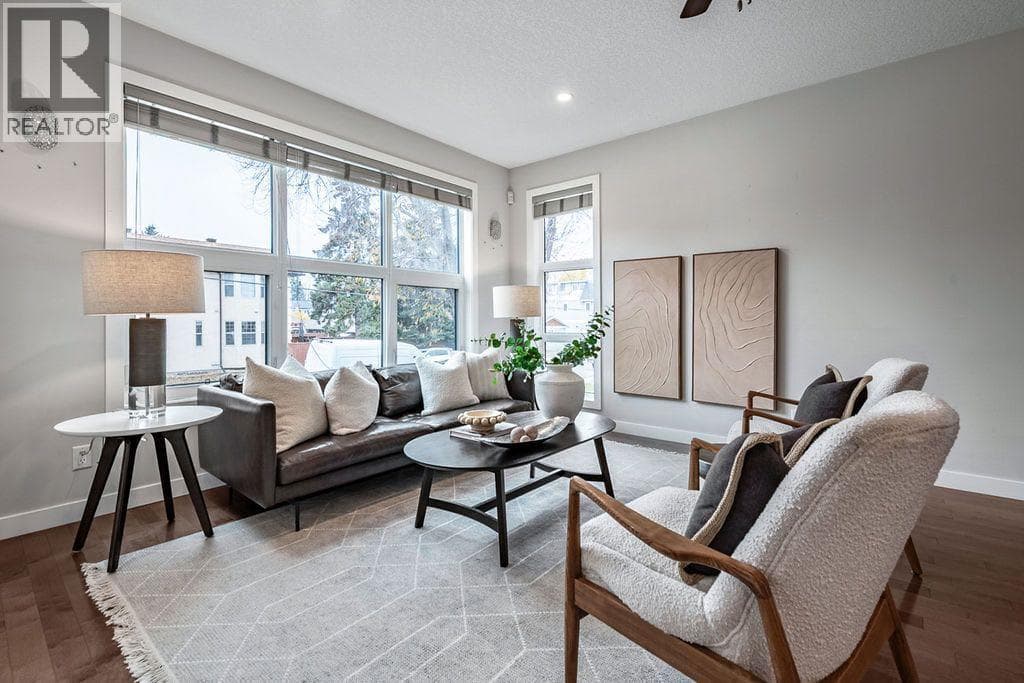
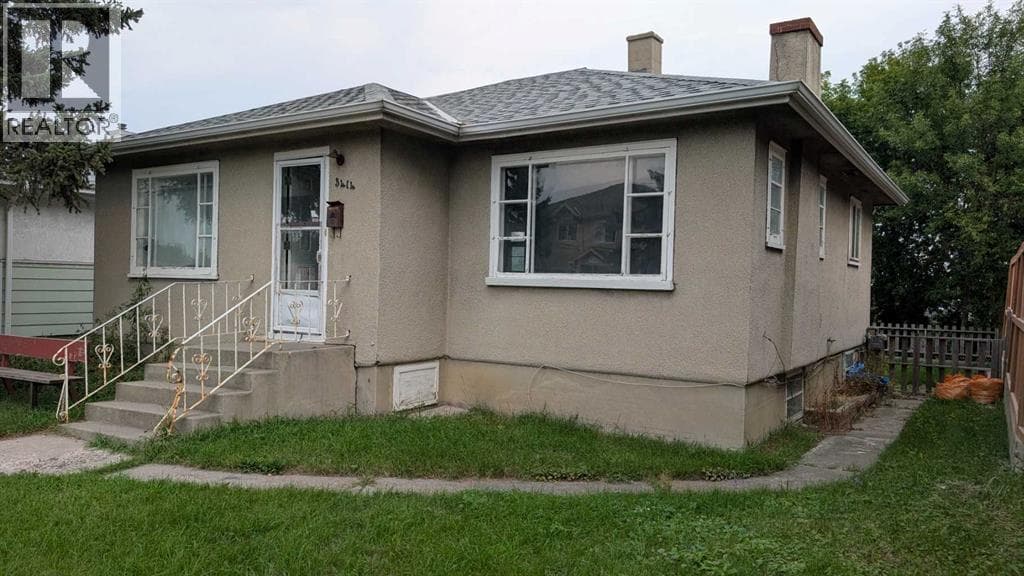
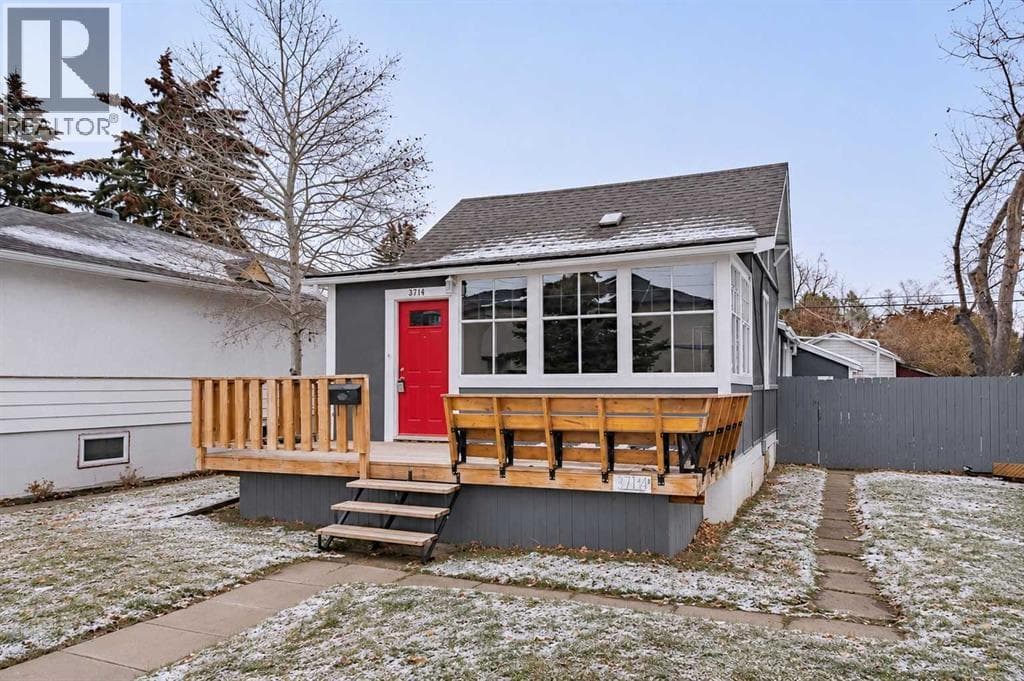
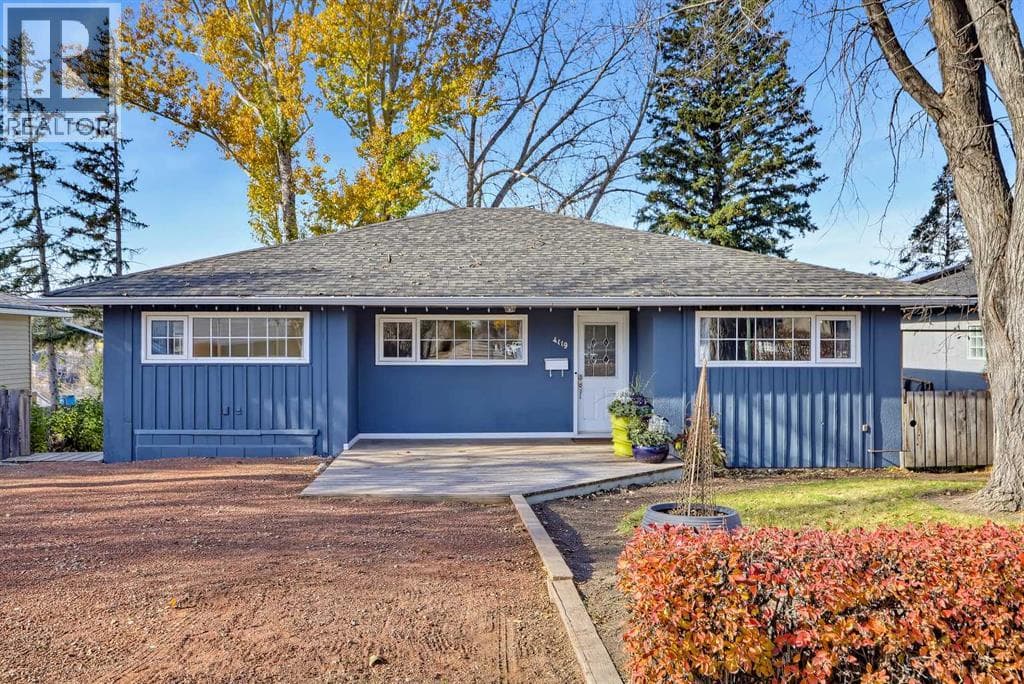
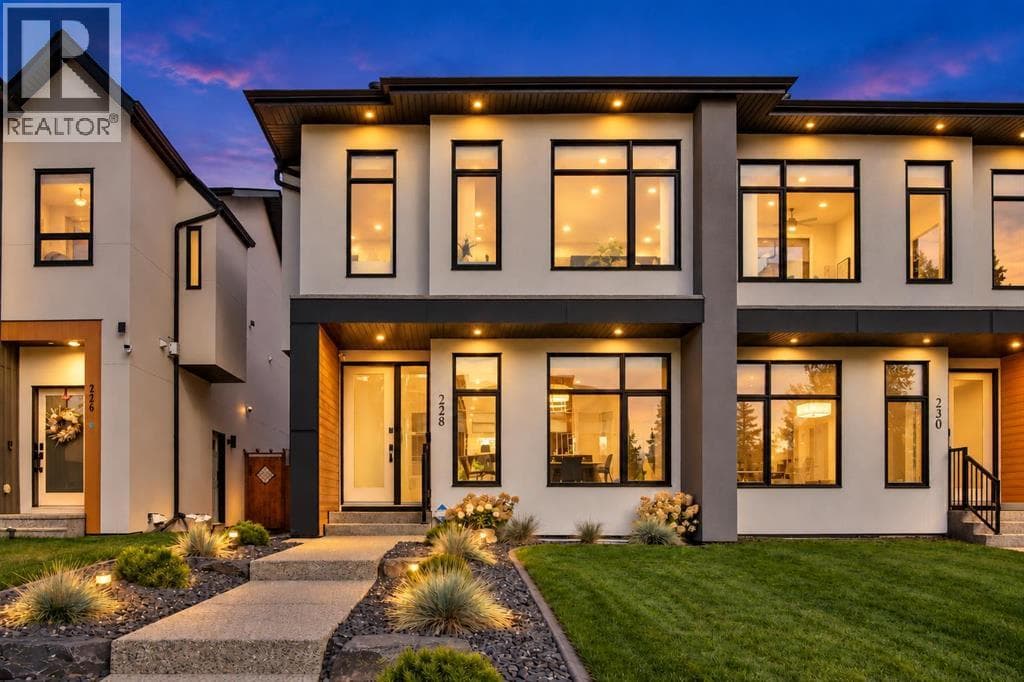
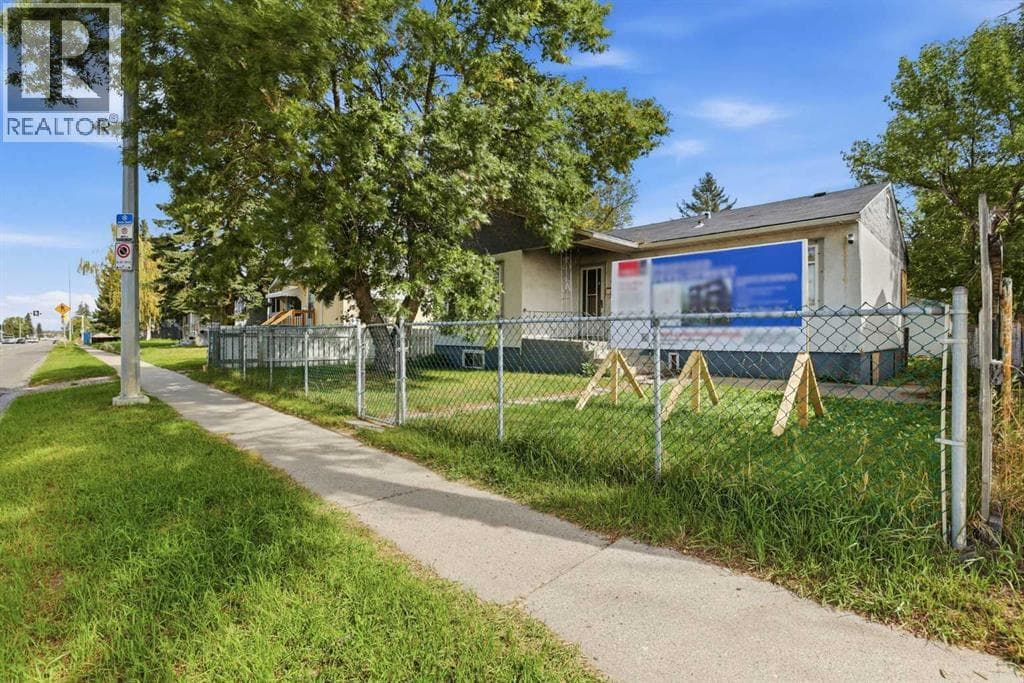
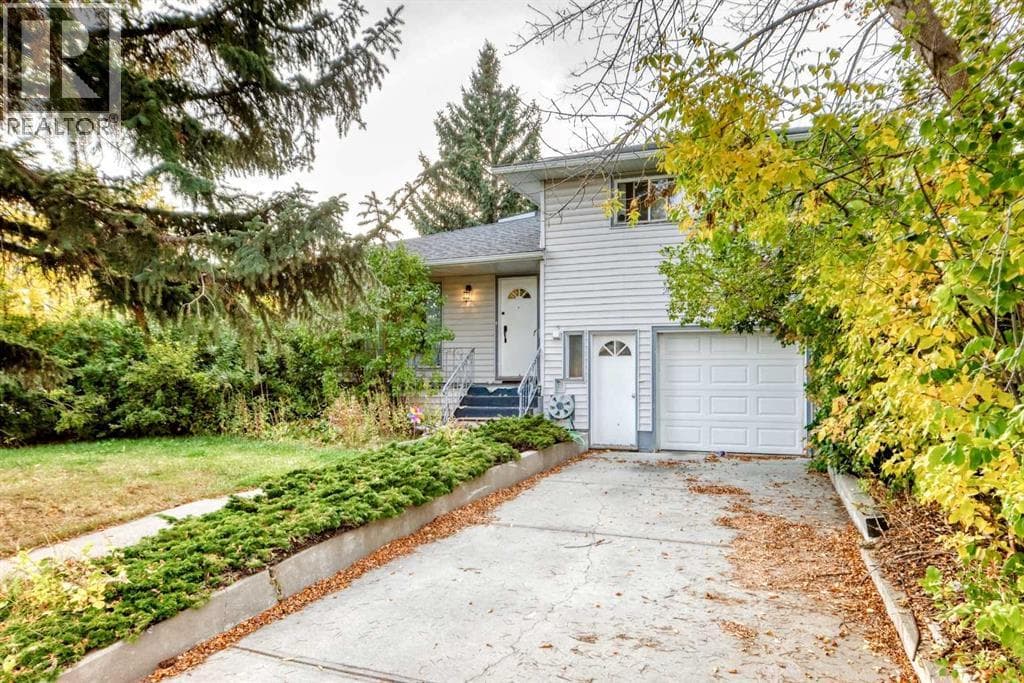
A home currently listed in Highland Park
Currently listed in Highland Park

Selling in Highland Park

Know your price.
Compare what you keep.

Don Wong brings local sales experience, full MLS exposure and personal negotiation to your Highland Park sale. Start with a free home evaluation and a clear breakdown of your selling costs.

Get my free Highland Park home evaluation ↗

How Don compares Highland Park homes.

Highland Park needs careful comparisons between established homes and newer infills. Don looks at lot dimensions, floor plan, renovation quality, parking and the home's condition. If land use or redevelopment potential is part of the sale, he checks the relevant information before making a marketing claim.

Prepare for the buyers you want to reach.

An older home and a newer infill need different preparation and pricing plans. Don explains the comparable sales, identifies the homes competing for your buyer and helps you present the features that support your price. He also helps you prepare for inspection and condition discussions.

Full service, with lower commission.

Don’s usual combined commission is 2%: 1% for the listing brokerage and 1% for the buyer’s brokerage, before GST. The service includes pricing advice, professional photos, MLS and Realtor.ca exposure, showing support, offer negotiation and guidance through closing.

On a $700,000 sale, 2% is $14,000 compared with $25,000 under the 7%/3% example—an $11,000 difference before GST. The comparison uses 7% on the first $100,000 and 3% on the balance. Commissions are Negotiable

Compare commission at your price ↗

Highland Park market stats

Residential sales through November 4, 2026. A figure is hidden when its own sample is under five. Counts are always shown.

Last 90 days counts 90 days, including the through date. Last 6 months is six calendar months. Year-to-date starts January 1.

Detached

Active now

Listings
10
Median list price
$769,450
List price range
$549,900–$1,199,900

Sold

Sales
4
Median sold price
— not enough sales yet
Sold price range
— not enough sales yet
Median days on market
— not enough sales yet
Median sale-to-list Sold price ÷ original list price
— not enough sales yet
Months of inventory Active listings ÷ sales per month
— not enough sales yet

By finished size

Each label comes from the export. The lower bound is included and the upper bound is excluded, so 1200-1599 means 1,200 up to but not including 1,600.

<1200 sq ft4Median — not enough sales yetRange — not enough sales yet
1200-1599 sq ft0Median — not enough sales yetRange — not enough sales yet
1600-1999 sq ft0Median — not enough sales yetRange — not enough sales yet
2000-2499 sq ft0Median — not enough sales yetRange — not enough sales yet
2500-2999 sq ft0Median — not enough sales yetRange — not enough sales yet
3000-3999 sq ft0Median — not enough sales yetRange — not enough sales yet
4000+ sq ft0Median — not enough sales yetRange — not enough sales yet

Semi-detached/Duplex

Active now

Listings
10
Median list price
$839,350
List price range
$699,999–$1,038,000

Sold

Sales
5
Median sold price
$798,500
Sold price range
$640,000–$957,900
Median days on market
18
Median sale-to-list Sold price ÷ original list price
94.8%
Months of inventory Active listings ÷ sales per month
5.9

By finished size

Each label comes from the export. The lower bound is included and the upper bound is excluded, so 1200-1599 means 1,200 up to but not including 1,600.

<1000 sq ft0Median — not enough sales yetRange — not enough sales yet
1000-1499 sq ft0Median — not enough sales yetRange — not enough sales yet
1500-1999 sq ft3Median — not enough sales yetRange — not enough sales yet
2000-2499 sq ft2Median — not enough sales yetRange — not enough sales yet
2500+ sq ft0Median — not enough sales yetRange — not enough sales yet

Row/Townhouse

Active now

Listings
2
Median list price
— not enough sales yet
List price range
— not enough sales yet

Sold

Sales
0
Median sold price
— not enough sales yet
Sold price range
— not enough sales yet
Median days on market
— not enough sales yet
Median sale-to-list Sold price ÷ original list price
— not enough sales yet
Months of inventory Active listings ÷ sales per month
— not enough sales yet

By finished size

Each label comes from the export. The lower bound is included and the upper bound is excluded, so 1200-1599 means 1,200 up to but not including 1,600.

<1000 sq ft0Median — not enough sales yetRange — not enough sales yet
1000-1399 sq ft0Median — not enough sales yetRange — not enough sales yet
1400-1799 sq ft0Median — not enough sales yetRange — not enough sales yet
1800-2199 sq ft0Median — not enough sales yetRange — not enough sales yet
2200+ sq ft0Median — not enough sales yetRange — not enough sales yet

Apartment

Active now

Listings
4
Median list price
— not enough sales yet
List price range
— not enough sales yet

Sold

Sales
0
Median sold price
— not enough sales yet
Sold price range
— not enough sales yet
Median days on market
— not enough sales yet
Median sale-to-list Sold price ÷ original list price
— not enough sales yet
Months of inventory Active listings ÷ sales per month
— not enough sales yet

By finished size

Each label comes from the export. The lower bound is included and the upper bound is excluded, so 1200-1599 means 1,200 up to but not including 1,600.

<600 sq ft0Median — not enough sales yetRange — not enough sales yet
600-799 sq ft0Median — not enough sales yetRange — not enough sales yet
800-999 sq ft0Median — not enough sales yetRange — not enough sales yet
1000-1299 sq ft0Median — not enough sales yetRange — not enough sales yet
1300-1599 sq ft0Median — not enough sales yetRange — not enough sales yet
1600+ sq ft0Median — not enough sales yetRange — not enough sales yet

Loading the five-year chart…

Calculated by Don Wong, 2% Realty Inc., from Pillar 9 MLS® data

Don Wong, REALTOR®, 2% Realty Inc.

The local market

Highland Park, by the numbers.

All residential property types combined. A change in the mix of homes sold can move the median without changing the value of every home.

Median sold price · past 12 months$675,000
Median days on market · past 12 months29
Community sales · past 12 months60

How your local market is moving

Completed months · all agents

Median sale price

$324k$590k$857kNov 25Feb 26May 26Aug 26Oct 26

Median days on market

4d38d72dNov 25Feb 26May 26Aug 26Oct 26

Homes sold

059Nov 25Feb 26May 26Aug 26Oct 26

Curved lines connect recorded figures; they do not average or predict prices. Gaps mean no sales or no metric. A few sales can move the median sharply. The current partial month or year is excluded.

See exact figures
Highland Park · All home types
PeriodSalesMedian priceMedian days
Nov 257$720,00043 days
Dec 252$670,00048 days
Jan 263$385,00051 days
Feb 263$510,00053 days
Mar 269$740,00026 days
Apr 267$670,00026 days
May 268$664,50016 days
Jun 266$677,50030 days
Jul 267$574,00029 days
Aug 261$795,00012 days
Sep 264$559,00038 days
Oct 262$788,95064 days

Powered by RealtyOS · Snapshot updated November 5, 2026. Chart shows completed months available in that snapshot. Community-wide figures include sales by all agents.

Your next step

What could your Highland Park home sell for?

Get recent comparable sales, a selling range and a full-service 2% commission estimate from Don, with 650+ Calgary-area homes sold.

What could you keep from your sale?

Save thousands with 2% commissionGet your free Home Estimate