


Woodbine · Detached homes
Selling in Woodbine? A strong summer, then a quieter August.
September 28, 2026 · By Don Wong
Woodbine recorded 25 detached sales against 27 new listings from June through August. But August alone tells a different story. Here is what both readings mean if you are thinking about selling.
A stronger summer than the year before
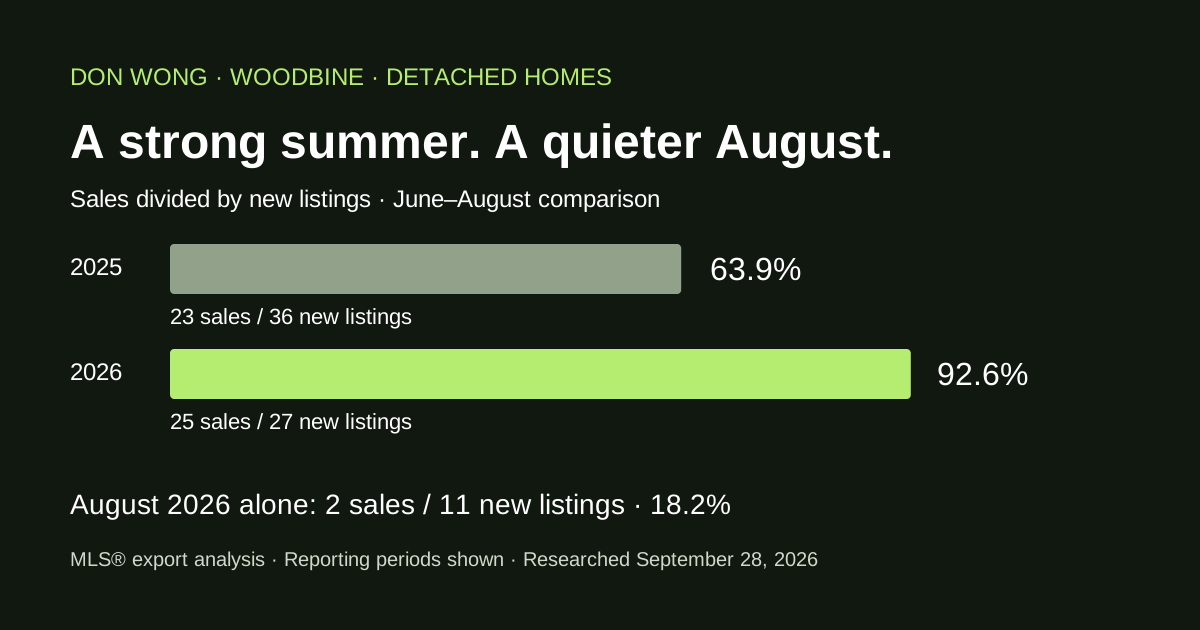
In our reconstruction of Calgary MLS® listing records, Woodbine had 25 detached sales and 27 new listings between June 1 and August 31, 2026. That puts its sales-to-new-listings ratio at 92.6%, compared with 63.9% in the same three months of 2025, when there were 23 sales and 36 new listings.
Sales increased by two while new listings fell by nine. That combination points to more sales relative to new listings over the summer. It does not mean that 92.6% of the homes listed during those months sold: some sales came from homes listed earlier.
| Period | Sales | New listings | Sales ÷ new listings |
|---|---|---|---|
| June–August 2026 | 25 | 27 | 92.6% |
| June–August 2025 | 23 | 36 | 63.9% |
The ratio rose by 28.7 percentage points. These are community-wide transactions by all agents, not my personal sales totals.
August is the reason I would not call every Woodbine home “hot”
The summer total hides a sharp change. June recorded 11 sales against 10 new listings; July recorded 12 against six. August recorded only two sales against 11 new listings, a ratio of 18.2%.
CREB®’s August detached figures independently show two sales, 11 new listings and 11 homes in inventory. Dividing that inventory by August sales gives 5.5 months of supply at that month’s pace. This is an August snapshot, not today’s available inventory or a prediction of how long your home will take to sell.
Two transactions are too few to describe every price range or home style reliably. The slowdown is a reason to check the homes buyers can choose from now, rather than price a September listing from July’s conditions alone.
What the price numbers can—and cannot—tell you
The median detached sale price for June–August 2026 was $738,000 across 25 sales, compared with $697,500 across 23 sales in the same period of 2025. The middle half of this summer’s sold prices ranged from $658,000 to $850,000.
Those figures describe the homes that sold. They do not establish that each Woodbine property gained value. Renovations, size, lot characteristics and the mix of homes sold can move the median. The two August sales had a median of $572,000; that small sample is not a sensible standalone valuation for a different home.
The broader September 2025–August 2026 window recorded 97 sales and 122 new listings, a 79.5% ratio. It provides longer-term context, but it overlaps calendar 2025 and should not be treated as a year-over-year comparison with it.
My approach if you are selling in Woodbine
I have sold homes in Woodbine this year. For your pricing review, I would compare your home with recent detached sales of similar size, age, layout and condition, then check current competition in your price range.
- Choose comparable homes carefully. A renovated home and one needing substantial work may compete for different buyers even on the same street.
- Prepare where it helps the sale. I will help you prioritize presentation and repairs before photography, rather than assume a large renovation will pay for itself.
- Set a price and a review plan. We will use relevant sales and active competition to choose an asking price, then review showing feedback and new competing listings together.
My service includes pricing advice, professional photography, MLS® exposure and offer negotiation. The combined commission example is 2% before GST: 1% to the listing brokerage and 1% to the buyer brokerage. Commissions are Negotiable.
Sources and reporting period
Researched September 28, 2026. Detached homes only; September is excluded because the month was incomplete. The June–August, prior-year and trailing-year figures are Don Wong’s analysis of MLS® exports retrieved through the existing RealtyOS/Pillar 9 research workflow. They are a current-record reconstruction, not CREB®’s official historical series.
Sales count distinct MLS® numbers in sold status with an Off Market Date in the reporting period. New listings count distinct MLS® numbers with a Listing Contract Date in that period across active, pending, sold, withdrawn, expired and terminated statuses. A relisting under another MLS® number is a separate listing event. Later corrections or status changes can revise these counts. A ratio over 100% is possible when sales include earlier inventory.
August inventory and its paired sales count come from the CREB® Housing Data Map, with Woodbine and Detached selected, retrieved September 28. The five-and-a-half-month supply calculation is 11 ÷ 2. Download the aggregate Woodbine figures used in this article (CSV).
This article keeps its original reporting period. Visit the Woodbine update archive for newer reports as they are published.