


Woodbine Calgary detached-home market update for sellers
Woodbine had 25 detached sales and 27 new listings in summer 2026, but August slowed. Read the numbers, their limits and Don Wong’s advice for sellers.
Read the market update ↗Thinking about selling in Woodbine? Compare recent detached-home sales, follow dated local market updates and get a pricing plan for your home from Don Wong.
Read the latest report, then look back at earlier updates to see how the market has changed. Each article keeps its original reporting period.
Woodbine had 25 detached sales and 27 new listings in summer 2026, but August slowed. Read the numbers, their limits and Don Wong’s advice for sellers.
Read the market update ↗Residential sales through November 7, 2026. A figure is hidden when its own sample is under five. Counts are always shown.
Last 90 days counts 90 days, including the through date. Last 6 months is six calendar months. Year-to-date starts January 1.
Each label comes from the export. The lower bound is included and the upper bound is excluded, so 1200-1599 means 1,200 up to but not including 1,600.
Each label comes from the export. The lower bound is included and the upper bound is excluded, so 1200-1599 means 1,200 up to but not including 1,600.
Each label comes from the export. The lower bound is included and the upper bound is excluded, so 1200-1599 means 1,200 up to but not including 1,600.
Each label comes from the export. The lower bound is included and the upper bound is excluded, so 1200-1599 means 1,200 up to but not including 1,600.
Loading the five-year chart…
Calculated by Don Wong, 2% Realty Inc., from Pillar 9 MLS® data
Don Wong, REALTOR®, 2% Realty Inc.
All residential property types combined. A change in the mix of homes sold can move the median without changing the value of every home.
Completed months · all agents
Curved lines connect recorded figures; they do not average or predict prices. Gaps mean no sales or no metric. A few sales can move the median sharply. The current partial month or year is excluded.
| Period | Sales | Median price | Median days |
|---|---|---|---|
| Nov 25 | 9 | $515,000 | 26 days |
| Dec 25 | 8 | $626,142 | 35 days |
| Jan 26 | 3 | $635,000 | 21 days |
| Feb 26 | 11 | $525,000 | 21 days |
| Mar 26 | 11 | $642,000 | 9 days |
| Apr 26 | 16 | $690,000 | 13 days |
| May 26 | 15 | $630,000 | 14 days |
| Jun 26 | 13 | $675,000 | 27 days |
| Jul 26 | 15 | $700,000 | 17 days |
| Aug 26 | 2 | $572,000 | 6 days |
| Sep 26 | 7 | $810,000 | 20 days |
| Oct 26 | 9 | $670,000 | 33 days |
Powered by RealtyOS · Snapshot updated November 8, 2026. Chart shows completed months available in that snapshot. Community-wide figures include sales by all agents.
17 homes currently for sale. See the latest listings below.
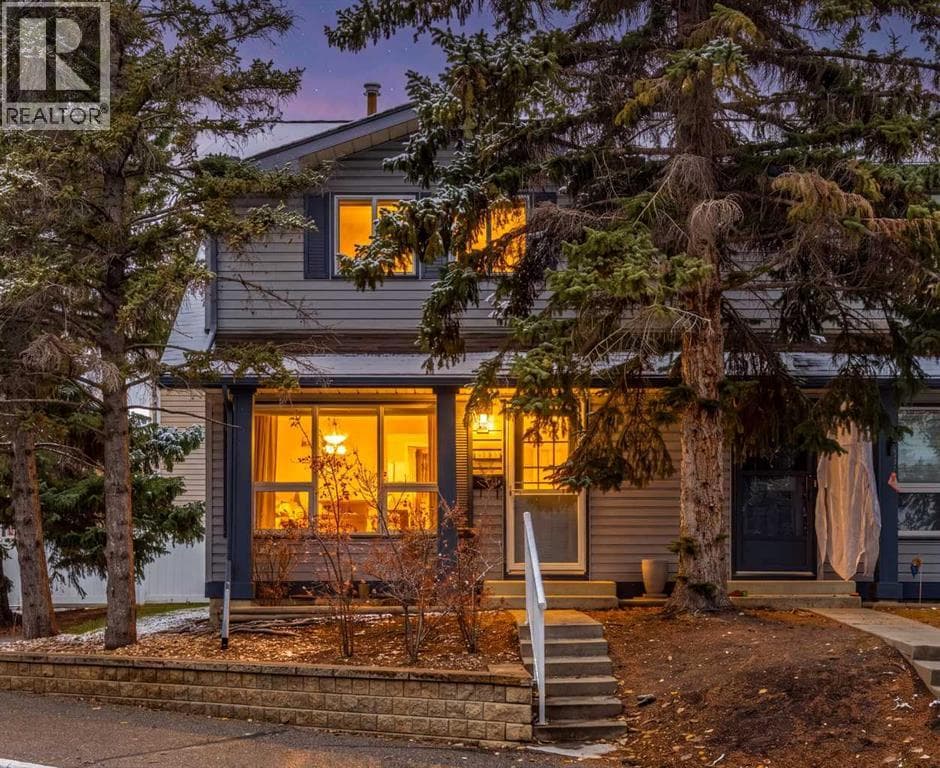
3 beds · 2 baths
MLS® A2355685 · Real Broker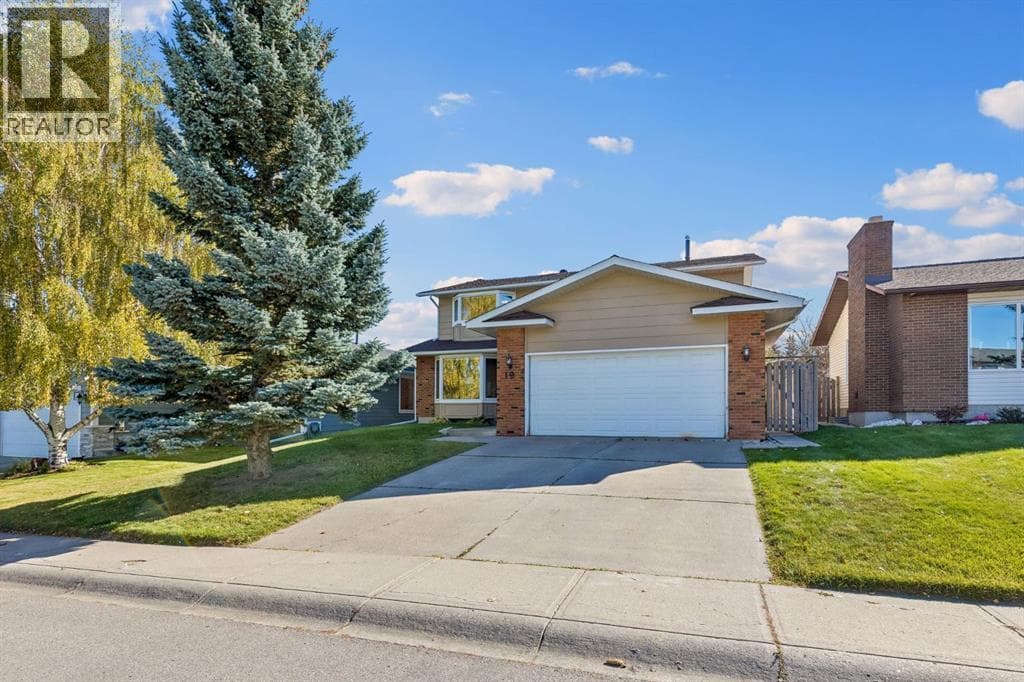
4 beds · 3 baths
MLS® A2351285 · RE/MAX First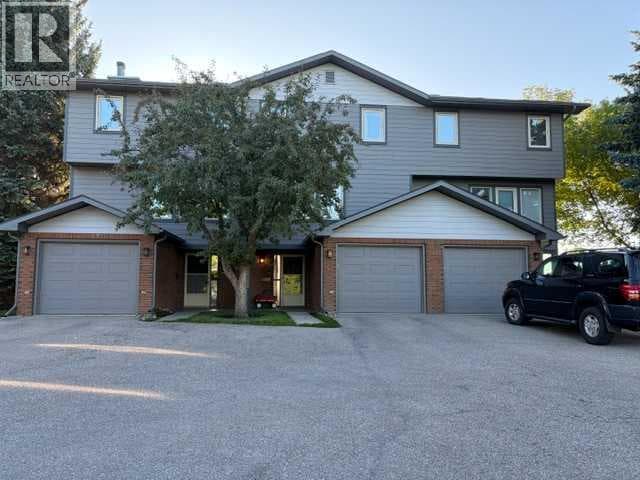
3 beds · 3 baths
MLS® A2347505 · J Capital Realty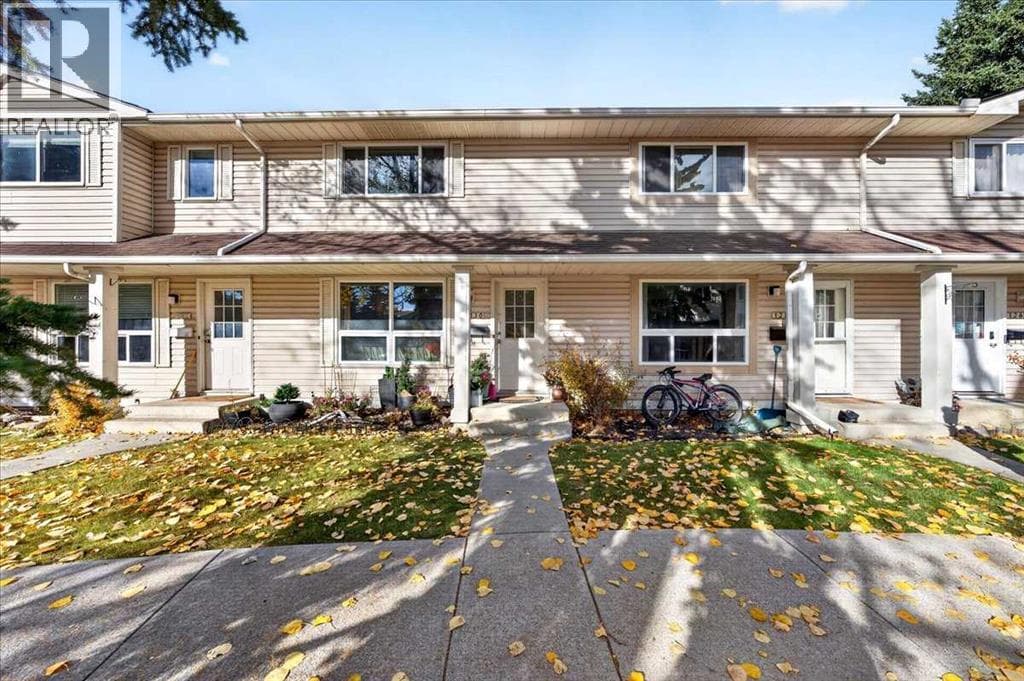
3 beds · 3 baths
MLS® A2351852 · CIR Realty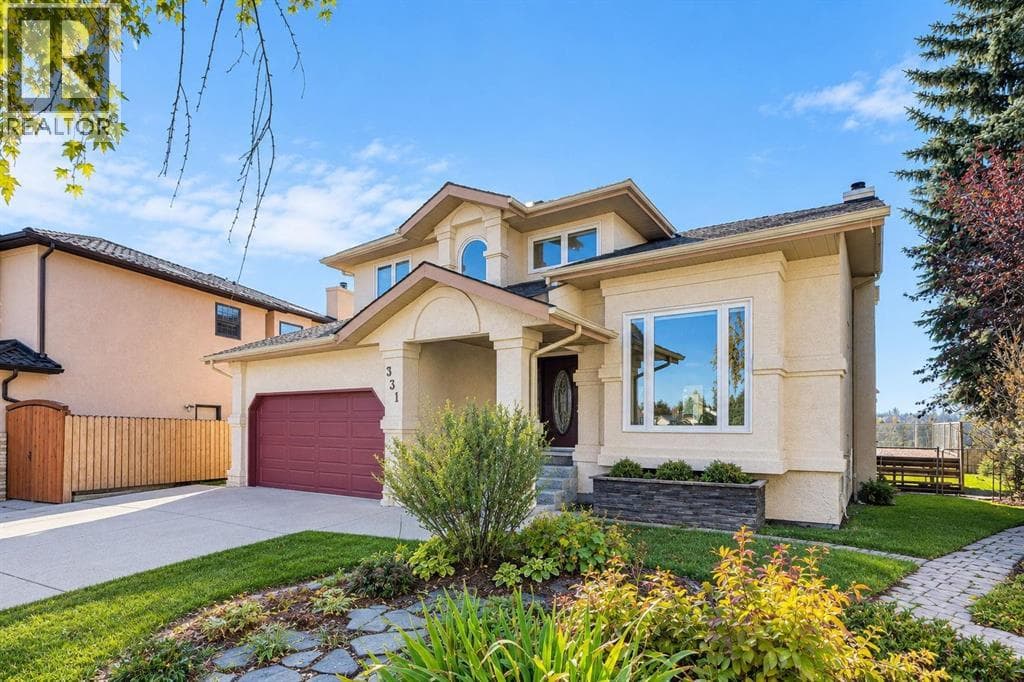
6 beds · 4 baths
MLS® A2353156 · eXp Realty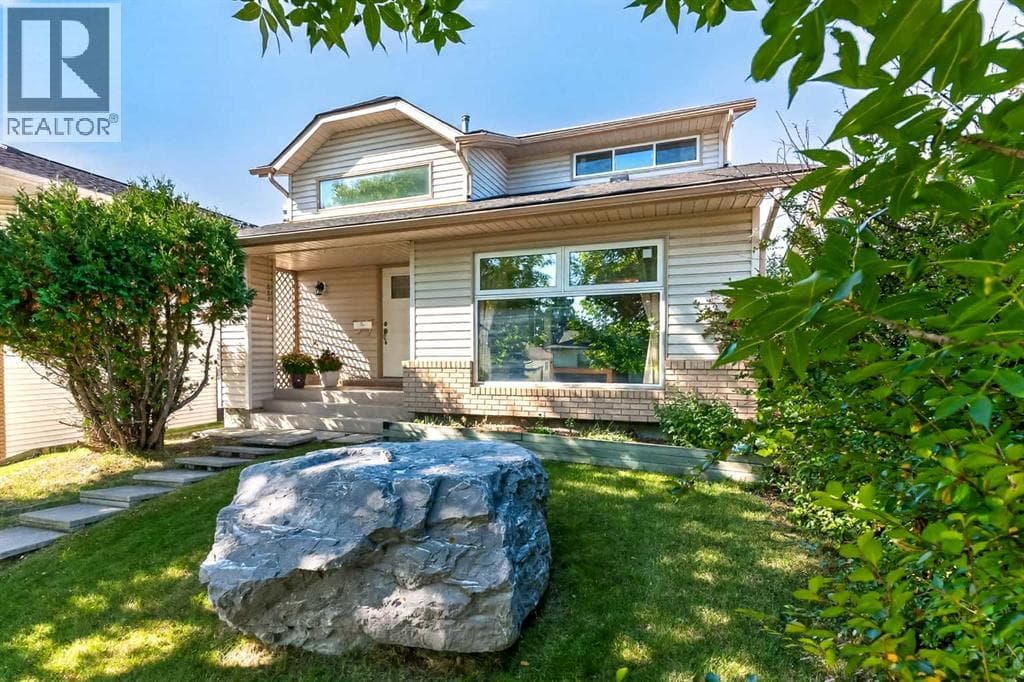
4 beds · 3 baths
MLS® A2346273 · First Place Realty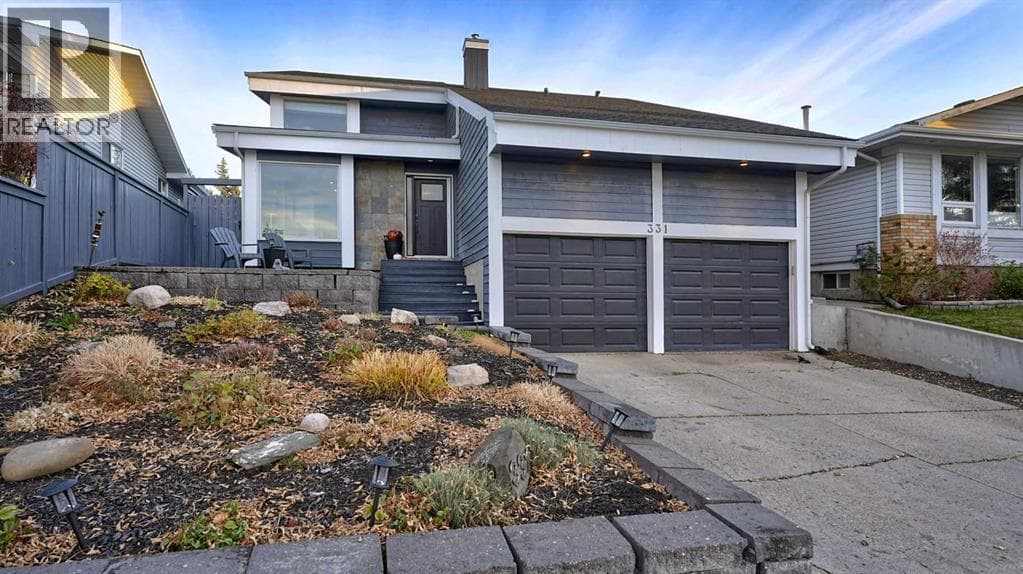
3 beds · 3 baths
MLS® A2352149 · Sotheby's International Realty Canada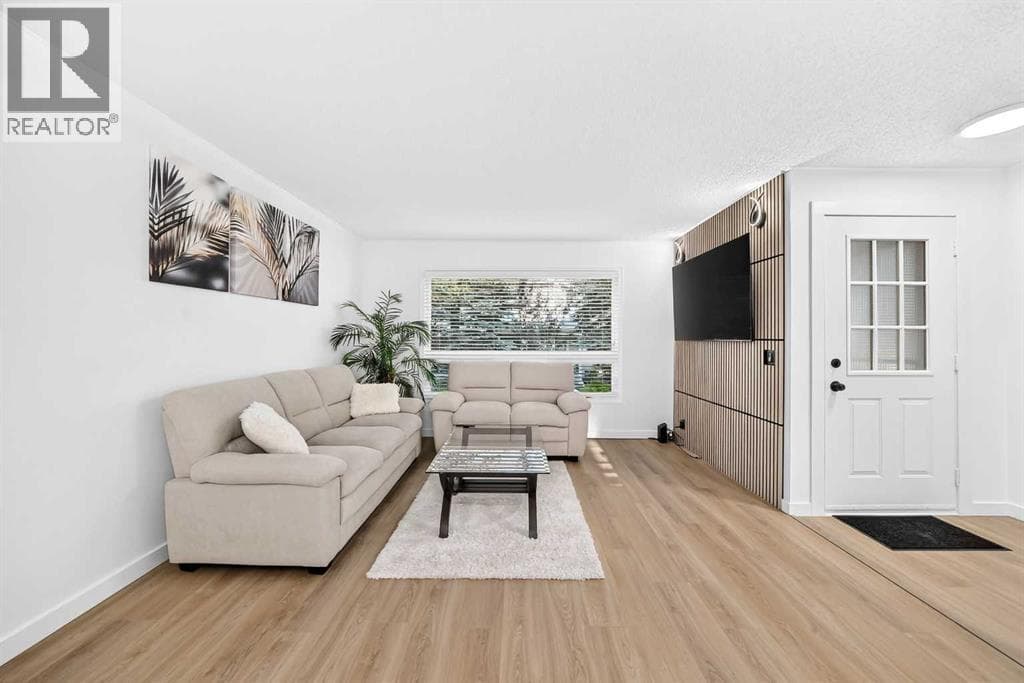
3 beds · 2 baths
MLS® A2339854 · Real Estate Professionals Inc.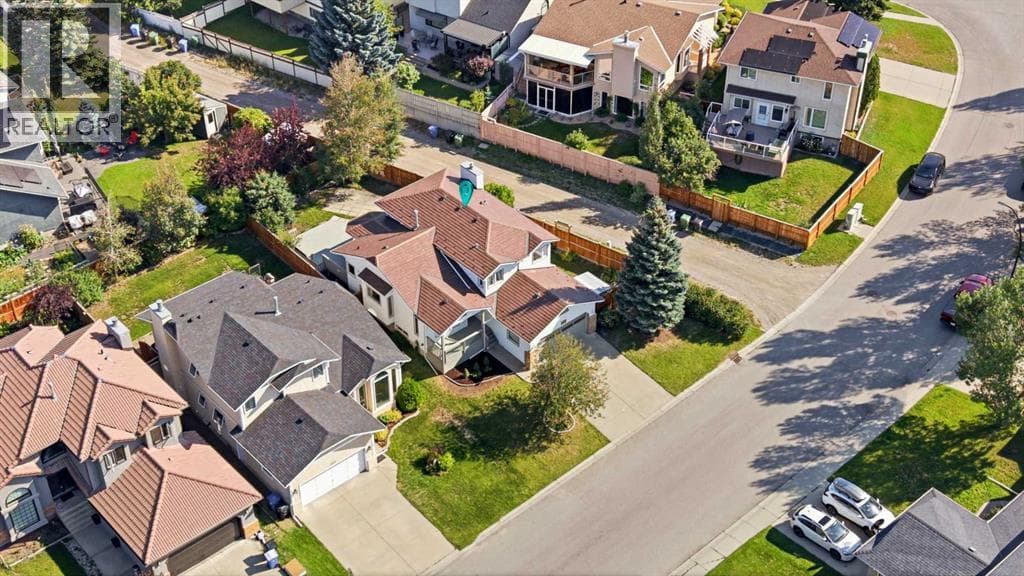
4 beds · 3 baths
MLS® A2352120 · Real Broker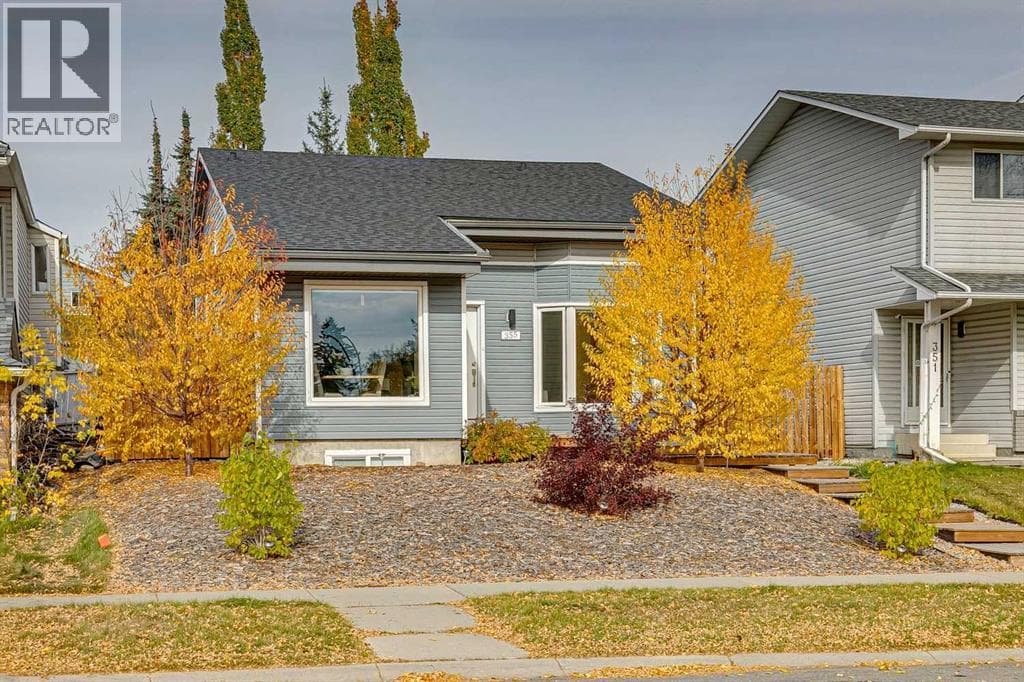
5 beds · 3 baths
MLS® A2351211 · Calgary West Realty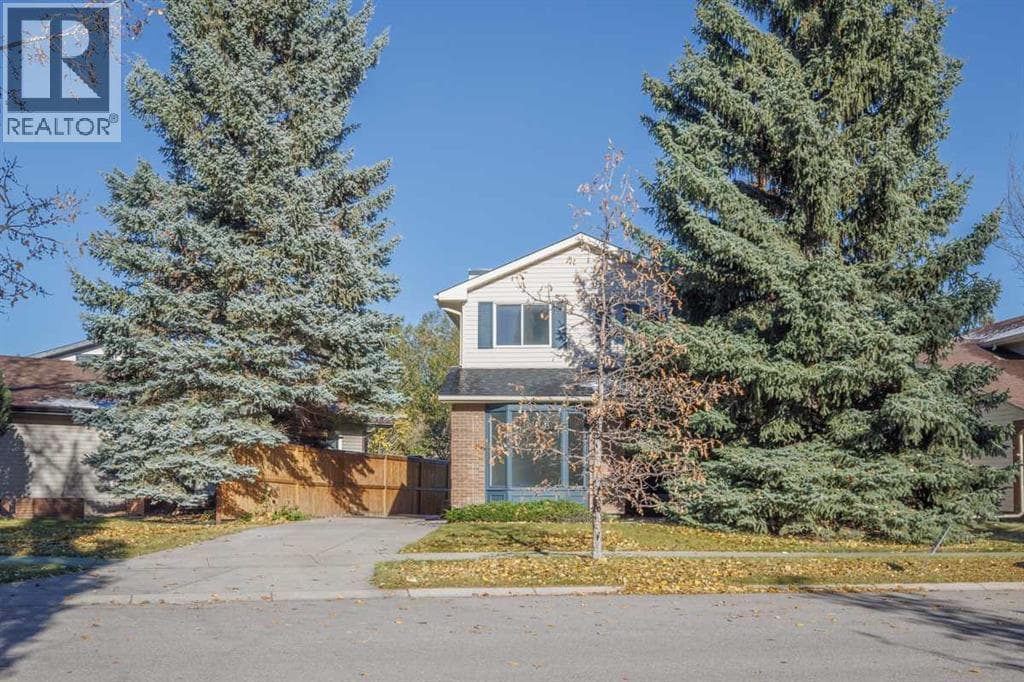
4 beds · 3 baths
MLS® A2351742 · Charles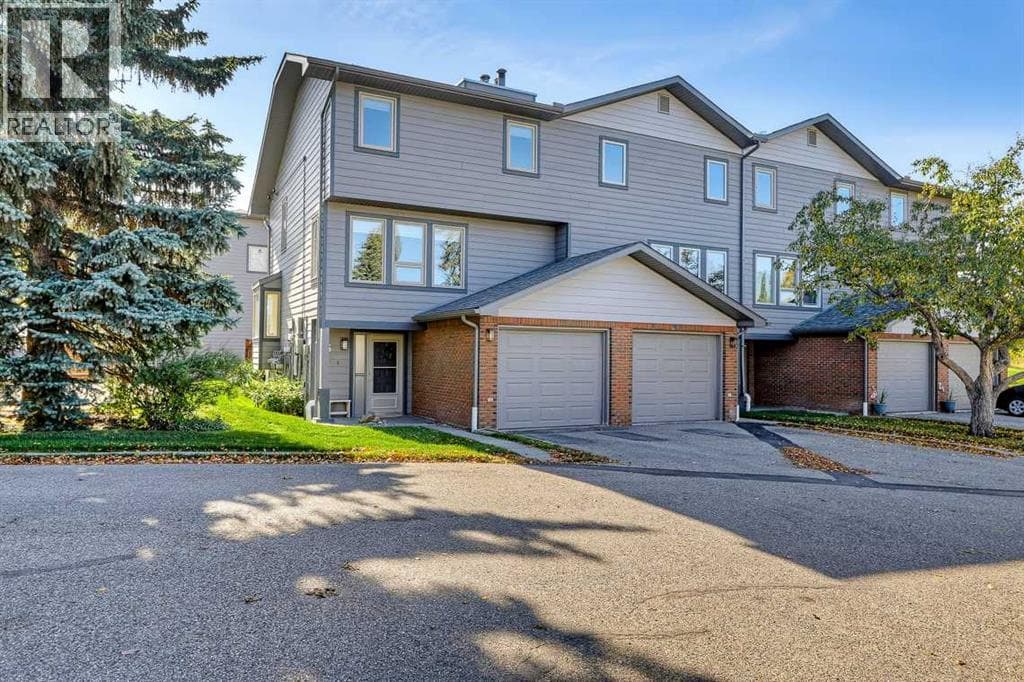
3 beds · 3 baths
MLS® A2349998 · Royal LePage BenchmarkListing data supplied through REALTOR.ca DDF®. Availability and asking prices can change. Checked 2026-11-08.
Get recent comparable sales, a selling range and a full-service 2% commission estimate from Don, with 650+ Calgary-area homes sold.